
A hammer candlestick is an essential pattern that signals a potential bullish reversal after a downtrend. You can recognize it by its small body located at the top of the trading range and a long lower shadow, which should be at least twice the body's length. This pattern indicates that sellers drove prices down, but buyers stepped in, pushing the price back up. To confirm the reversal, the next candlestick needs to close above the hammer's body. Understanding this pattern can enhance your trading strategy, especially when combined with other technical indicators and analysis.
Key Takeaways
- A hammer candlestick forms during a downtrend, featuring a small body and a long lower shadow at least twice its size.
- It indicates potential bullish reversal, suggesting buyer strength overcoming seller pressure after a price decline.
- Confirmation is needed; the next candlestick must close above the hammer's body to validate the reversal signal.
- The hammer pattern is historically significant, often leading to gains of 10-15% when confirmed with other indicators.
- It differs from other candlesticks, such as the doji and shooting star, which represent different market sentiments and trends.
Key Characteristics of Hammers

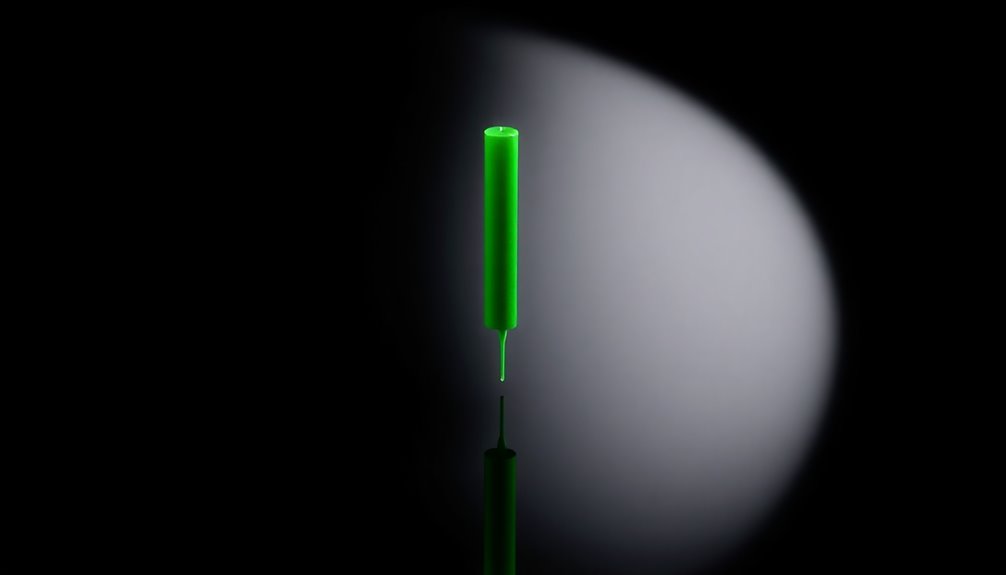
When analyzing candlestick patterns, one of the most notable formations you'll encounter is the hammer. This candlestick is characterized by a small body located at the upper end of the trading range, signaling a potential bullish reversal after a downtrend.
The defining feature of a hammer is its long lower shadow, which should be at least twice the length of the body. This indicates significant downward price movement followed by a recovery, suggesting buyers are gaining strength.
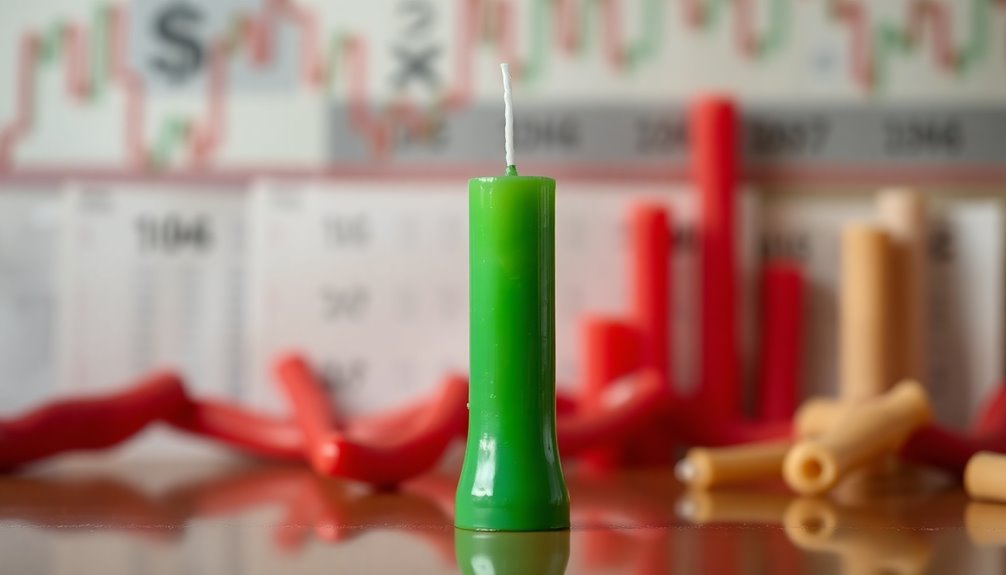
While the body can be green or red, its color doesn't impact the pattern's significance. For confirmation of the hammer pattern, look for the next candlestick to close above the hammer's body, reinforcing the possibility of a trend reversal.
Historical Significance in Trading
The hammer candlestick pattern has played a significant role in trading history, with its roots tracing back to the 18th century when Japanese rice traders first used candlestick charting.
This pattern often appears after a downward trend, indicating a potential price reversal and marking a shift in market sentiment.
Historical backtesting reveals that hammer patterns frequently signal bullish reversals, especially when combined with other technical indicators like volume or RSI.
The psychological impact of this pattern stems from its demonstration of buyer strength overcoming seller pressure, reinforcing the notion of a market turnaround.
Traders have noted that confirmed hammer patterns can lead to gains of 10-15% within several sessions, showcasing its significance in effective market analysis.
Formation and Interpretation Process

To understand the formation and interpretation of a hammer candlestick, it's essential to recognize its distinct characteristics.
This pattern forms during a downtrend, marked by a small body at the top and a long lower shadow that's at least twice the size of the body. Typically, the price opens lower, creates the long lower shadow, and rallies back to close near the opening price, showcasing buyer strength.
For a hammer to signal a potential reversal, it must appear near established support levels. You'll need confirmation, too—look for the next candlestick to close above the hammer's close.
While the body color, green or red, has minimal impact, a green body may enhance bullish sentiment in your trading strategy.
Pros and Cons Summary
While the hammer candlestick pattern can signal a potential bullish reversal, it's important to weigh both its advantages and drawbacks.
One major pro is that it indicates buyer strength after a downtrend, especially when formed near support levels, enhancing the likelihood of price recovery.
However, relying solely on this pattern can lead to false signals, so a confirmation candle closing above the hammer's body is essential for validating the reversal.
Additionally, the hammer doesn't provide explicit price targets, making effective risk management vital. This often involves stop-loss placements below the hammer's low.
To improve your trading decisions, consider using additional technical analysis tools alongside the hammer candlestick to mitigate risks and enhance reliability.
Hammer vs. Other Candlesticks
Understanding how the hammer candlestick compares to other patterns can enhance your trading strategy. The hammer features a long lower shadow and a small body, signaling a potential bullish reversal after a downtrend.
In contrast, the doji has a small body centered between its shadows, indicating indecision and can appear in various market conditions.
The shooting star, which has a long upper shadow, signals a bearish reversal after an uptrend, reflecting opposing market sentiment.
Similarly, the hanging man resembles the hammer but appears at the top of an uptrend, suggesting a bearish reversal.
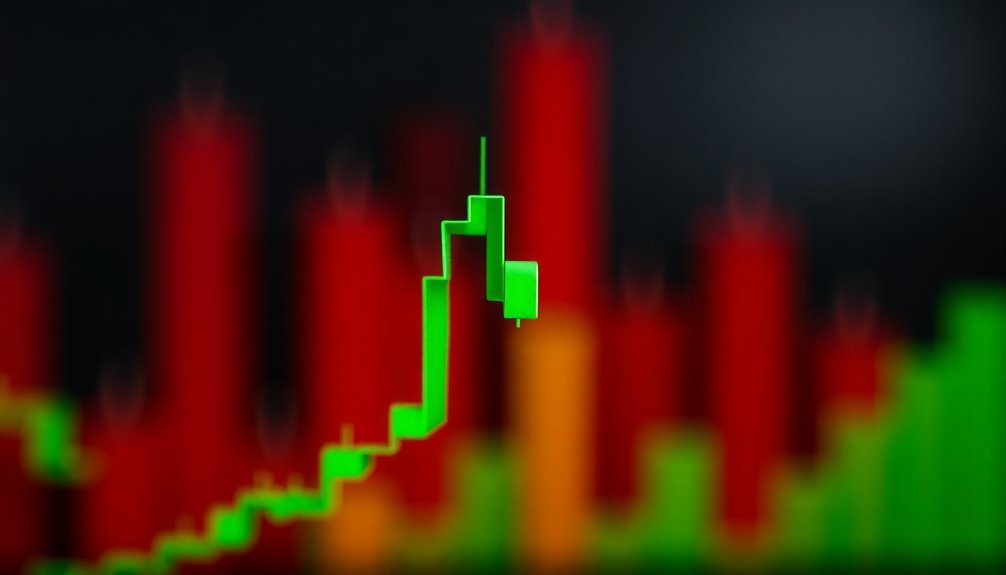
Market Volatility Impacts Reliability

Market volatility plays a significant role in determining the reliability of the hammer candlestick pattern. When you trade during high volatility, erratic price movements can lead to false signals, making it harder to trust the hammer pattern. In such conditions, the chance of a price reversal following a hammer decreases, so you'll want to wait for a confirmation candle to increase your reliability.
Conversely, when volatility is low, price movements are more predictable, enhancing the reliability of the hammer. To better assess market volatility, consider using indicators like Bollinger Bands or Average True Range (ATR).
Also, remember that historical data suggests you may need larger stop-loss margins in volatile markets, which can impact your risk management strategies.
Emerging Algorithmic Trading Strategies
As technology advances, traders are increasingly turning to emerging algorithmic trading strategies that leverage the hammer candlestick pattern to identify potential bullish reversals. These strategies utilize sophisticated algorithms to analyze market data and detect patterns that may indicate a shift in momentum. In conjunction with traditional technical indicators, traders are also exploring innovative approaches such as aipowered crypto portfolio strategies, which can dynamically adjust based on real-time market conditions. This allows traders to not only spot potential bullish reversals signaled by the hammer candlestick but also to optimize their investment decisions for maximum profitability.
By programming algorithms to recognize hammer formations across various timeframes, you can enhance the speed and efficiency of trade execution compared to manual analysis. Incorporating machine learning techniques optimizes your algorithms, improving accuracy in pattern recognition and reducing false signals.
Many platforms enable backtesting strategies focused on hammer candlestick signals, allowing you to assess past performance and refine your approach.
Additionally, advanced algorithms may integrate hammer candlestick recognition with other technical indicators, such as volume analysis or moving averages, to boost the reliability of your trade entries and exits in market analysis.
Use Multiple Timeframes Analysis

How can you enhance your trading strategy? By using multiple timeframes analysis, you can gain a clearer perspective on the market.
When you spot a hammer candlestick pattern on a lower timeframe, check if it aligns with support levels or similar patterns on higher timeframes. This alignment can provide confirmation of the trend's potential for reversal.
For instance, a hammer on a daily chart becomes more significant when it coincides with the same pattern on the weekly or monthly charts.
This thorough view allows you to assess broader market trends and identify potential resistance areas that could impact price movement.
Ultimately, combining insights from different timeframes mitigates the risks of false signals and strengthens your trading decisions.
Frequently Asked Questions
What Does a Hammer Candlestick Indicate?
A hammer candlestick indicates a potential shift in market sentiment after a price decline. When you spot one, it signals that buyers are starting to gain strength, even after sellers pushed prices down.
You'll notice a small body at the top and a long lower shadow, which shows rejection of lower prices. To confirm this pattern, look for the next candlestick to close above the hammer's body, reinforcing the bullish signal.
Can a Hammer Candle Be Bearish?
You might think a hammer candle's always bullish, but hold on! It can actually signal a bearish reversal too, especially when it appears at the top of an uptrend.
This is where it transforms into a "hanging man." If you see that long lower shadow and a small body, pay attention. A confirmation from the next candlestick will help you decide if it's time to shift your strategy.
Stay alert!
Is Red Hammer Candle Bullish?
A red hammer candle can signal a potential bullish reversal, but it's not as strong as a green hammer.
When you see one, it means sellers initially pushed prices lower, but buyers stepped in, closing near the opening price.
To confirm the bullish signal, you'll want to look for the next candlestick. If it closes above the hammer's body, that strengthens the case for a reversal, so always consider the market context.
Is a Hammer Candlestick Good or Bad?
A hammer candlestick can be both good and bad, depending on the context.
If it appears after a downtrend and is confirmed by subsequent bullish candles, it's generally a positive sign, indicating potential price increases.
However, if it forms without confirmation, it might lead to false signals.
Always remember to manage your risk, as the potential for upward movement doesn't guarantee profits.
Stay cautious and consider stop losses to protect your investment.
Conclusion
In summary, understanding the hammer candlestick is essential for any trader who wants to reveal the secrets of market movements. Its unique characteristics can signal potential reversals, making it a powerful tool in your trading arsenal. While it's not foolproof, when combined with other strategies and analyzed across multiple timeframes, it can feel like you've discovered a hidden treasure in the chaotic world of trading. So, keep your eyes peeled for those hammers!