

Candlesticks are vital tools in technical analysis that help you visualize price movements effectively. Each candlestick consists of a body and shadows, showcasing the opening, closing, highest, and lowest prices within a specific time frame. The color of the body indicates market direction: green for bullish and red for bearish. Longer bodies suggest greater price volatility, while the shadows reveal rejection levels in the market. By studying candlestick patterns, you can gain insights into trends and potential reversals, enhancing your trading strategies. There's much more to explore about how candlesticks can refine your market analysis.
Key Takeaways
- A candlestick is a visual representation of price movements in a specific time period, displaying open, high, low, and close prices.
- Each candlestick consists of a body that indicates price direction, with green for bullish and red for bearish movements.
- The length of the candlestick body reflects market volatility, with longer bodies suggesting stronger buying or selling pressure.
- Candlestick charts provide more detailed insights than line charts, highlighting market sentiment and potential trend reversals.
- Patterns formed by candlesticks can aid in predicting future price movements, enhancing trading strategies and decision-making.
Top picks for "candlestick"
Open Amazon search results for this keyword.
As an affiliate, we earn on qualifying purchases.
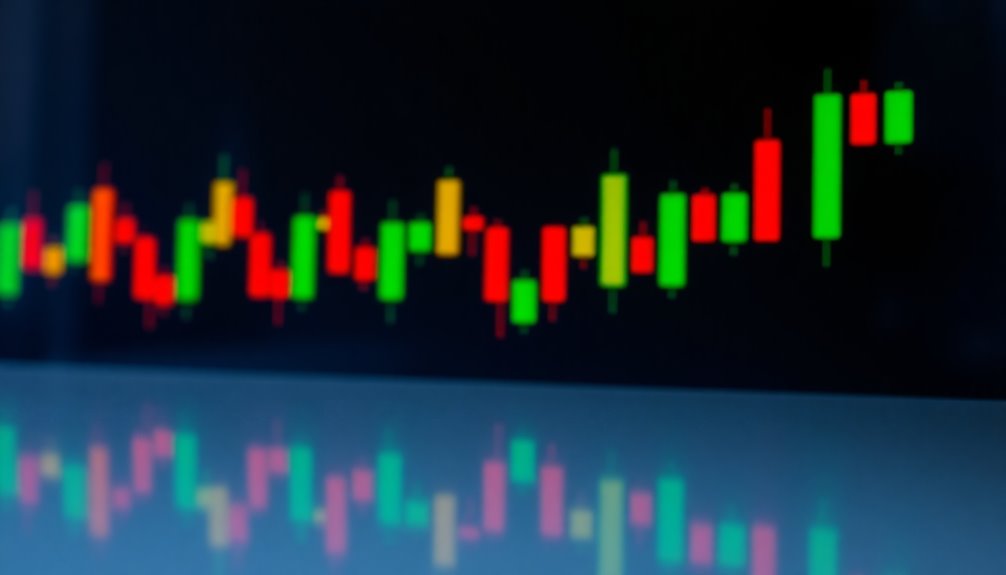
Candlestick Structure Overview

Candlesticks serve as essential tools in technical analysis, offering a visual representation of price movements over specific time periods. Each candlestick consists of a body that shows the difference between opening and closing prices.
The color of the body reveals market direction: a green body indicates a bullish close, while a red body signals a bearish close. The length of the body reflects price volatility; longer bodies suggest strong buying or selling pressure, whereas shorter bodies imply indecision among traders.
Additionally, shadows, divided into upper and lower parts, indicate the highest and lowest prices during the period. The upper shadow represents the price peak, while the lower shadow shows the price low, providing valuable insights into price rejection levels.
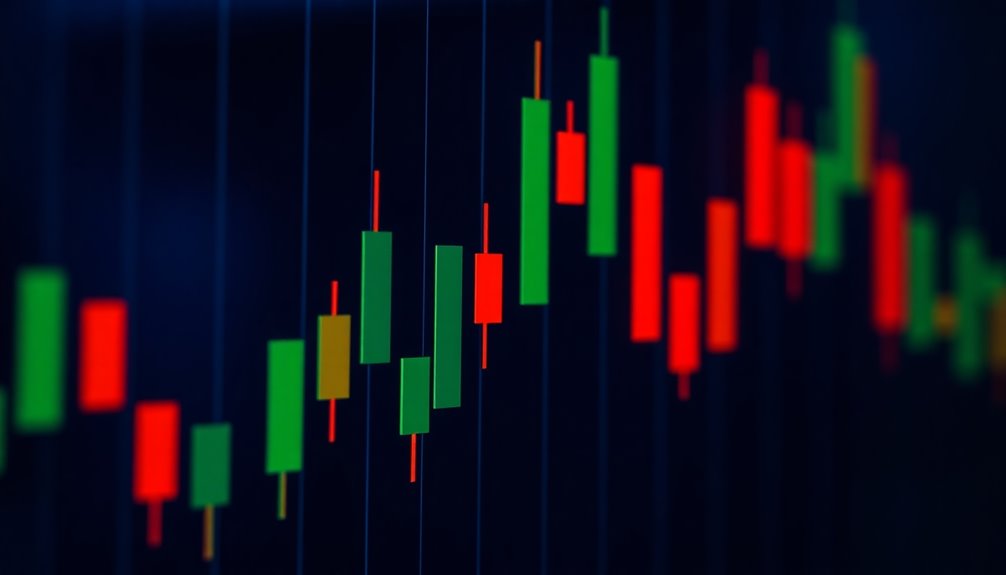
Candlestick Chart Overview
A candlestick chart is a powerful tool that visually captures price movements over a specified period, showcasing the open, high, low, and close prices for each time frame.
Each candlestick features a body that represents the difference between the opening and closing prices, along with shadows indicating the highest and lowest prices during that period.
The colors of the candlesticks convey market direction: green (or white) for bullish movements and red (or black) for bearish movements.
Originating from Japan in the 18th century, candlestick charts offer more insights than traditional line charts.
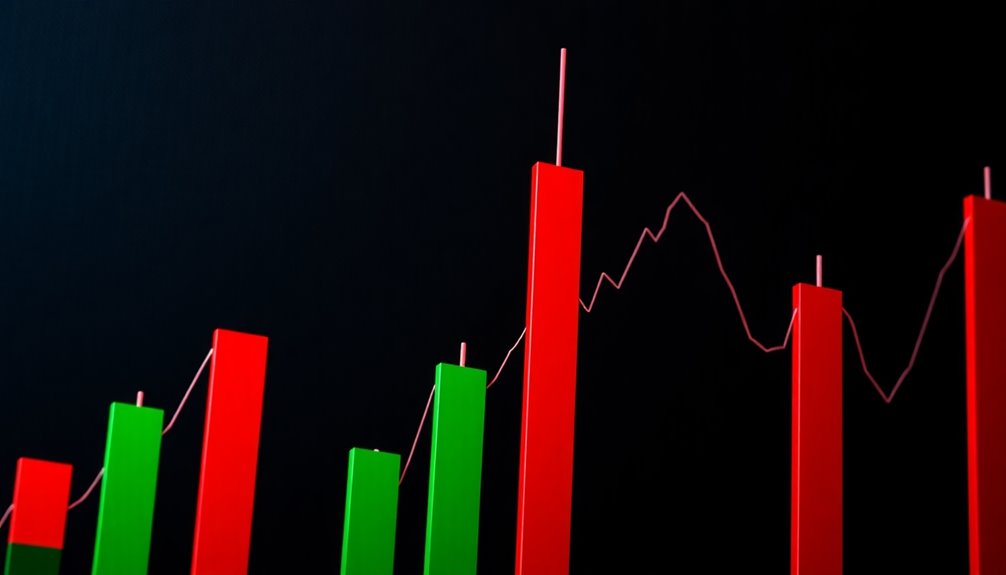
Price Movement Visualization Technique
When analyzing financial markets, the price movement visualization technique offered by candlestick charts can be incredibly effective.
These charts show price movements over specific time periods, including the opening price, closing prices, and the highest and lowest prices in one candle. Each candlestick's body reflects the difference between opening and closing prices, with green indicating bullish movement and red signaling bearish movement.
The length of the body reveals market sentiment—longer bodies suggest stronger price action, while shorter ones indicate indecision. By studying candlestick patterns, you can identify trends and potential reversals, enhancing your trading strategies.
This visualization technique provides a clear, concise way to interpret market behavior, making it easier for you to make informed decisions.
Pros and Cons of Candlesticks

Analyzing price movements through candlestick charts offers clear insights into market behavior, but it's important to weigh their pros and cons.
Candlestick patterns provide a visual representation of market sentiment and can signal potential trend reversals, enhancing your trading strategies. However, they can also produce false signals, so context and additional analysis with technical indicators like RSI or MACD are crucial for accuracy.
The effectiveness of these patterns varies with timeframe; longer periods often yield clearer signals.
Beware of over-reliance on candlestick patterns, especially during significant market events that may invalidate established patterns.
Combining candlestick analysis with other tools can significantly improve your chances of successful trades while mitigating risks.
Candlesticks vs. Line Charts
Candlestick charts offer a richer perspective on price movements compared to line charts. While line charts only show closing prices over time, candlestick charts display the open, high, low, and closing prices, giving you a detailed view of price movement.
Each candlestick represents a specific time interval, allowing you to identify candlestick patterns that signal potential market reversals or continuations. The color of the candlesticks—green for bullish and red for bearish—provides immediate visual cues about market sentiment, which line charts lack.
This enhanced detail helps you engage in better technical analysis, as candlestick charts illustrate market psychology and volatility through the size and shape of the candlesticks, offering insights that can significantly improve your trading decisions.
Market Volatility Impacts Predictions
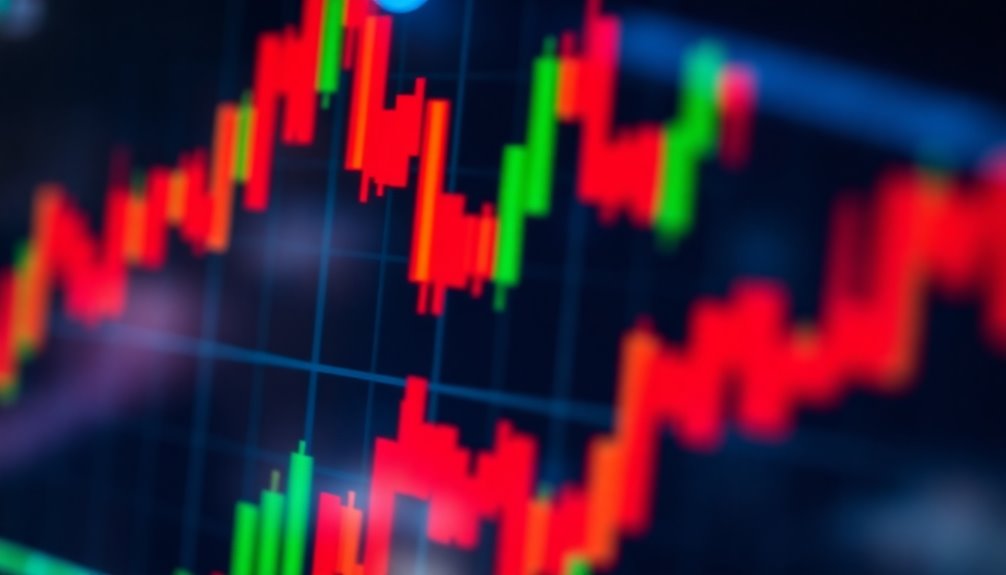
Understanding market volatility is key to accurately interpreting candlestick patterns. When volatility spikes, you'll notice larger candlestick bodies and longer wicks, reflecting increased buying and selling pressure.
These extended shadows can indicate market rejection levels, hinting at potential reversal patterns like the Hammer or Shooting Star. In volatile conditions, these patterns often signal trend changes due to rapid price movements.
However, you should approach these signals with caution, as erratic price behavior can lead to false patterns. To enhance your trading decisions, utilize historical volatility data alongside technical indicators.
This context helps you assess the reliability of current candlestick patterns based on past market behavior, ultimately improving your analysis and trading outcomes.
Emerging Candlestick Trading Strategies
While navigating the complexities of trading, you can leverage emerging candlestick strategies to enhance your decision-making process.
For a trend following strategy, focus on candlestick patterns like the Rising Three Methods or Three White Soldiers, which signal bullish momentum. Conversely, implement a reversal trading strategy by recognizing patterns such as the Evening Star or Shooting Star that may indicate a shift in trend.
Incorporating volume analysis is crucial; for instance, an increased volume during a bullish engulfing pattern confirms significant buying interest. Additionally, using the RSI can provide confirmation signals for your entries and exits.
Utilize Volume for Confirmation
One key aspect of trading that can significantly enhance your strategy is volume analysis. When you see a bullish candlestick accompanied by high volume, it indicates strong buying interest and provides confirmation of potential price movement.
For instance, a bullish engulfing pattern with increased volume suggests a higher probability of a successful trend reversal. Conversely, if you encounter a bearish pattern like a shooting star with high volume, it signals stronger selling pressure, increasing the likelihood of a downward trend.
Additionally, volume spikes during doji formations can highlight market indecision, requiring further confirmation before acting. Incorporating tools like On-Balance Volume (OBV) can further refine your trading signals, ensuring more accurate decisions based on volume trends.
Frequently Asked Questions
What Is Candlestick in Trading?
In trading, you'll encounter a candlestick as a powerful tool for visualizing price movements. Each candlestick showcases the opening, closing, high, and low prices over a specific timeframe.
The body of the candlestick reflects the price range, while the wicks indicate extremes. You can quickly gauge market sentiment by the color—green for bullish and red for bearish.
Analyzing candlestick patterns helps you identify potential market reversals and continuations, enhancing your trading strategy.
What Is the Meaning of the Candlestick?
The meaning of a candlestick lies in its ability to illustrate price movements over time.
When you look at a candlestick, you see the opening and closing prices, along with the highest and lowest prices during that period. The body's color tells you whether the market closed higher or lower than it opened.
What Is Candlestick Psychology?
Candlestick psychology focuses on interpreting market emotions and behaviors through price movements on charts.
When you analyze candlestick patterns, you're looking for insights into trader sentiment—like fear or greed.
For instance, a long green candlestick can signal strong buying pressure, while a long red one indicates selling pressure.
What Were Candlesticks Used For?
Candlesticks were used to track price movements and analyze market trends. They help you visualize open, high, low, and close prices over specific time periods, making it easier to gauge market sentiment.
Conclusion
In the world of trading, candlesticks are your guiding stars, illuminating the path through darkness. They don't just tell you where the price has been; they whisper secrets of market movements, revealing emotions of buyers and sellers alike. By embracing these symbols, you can navigate the volatile seas of trading with confidence. Remember, each candlestick holds a story—listen closely, and let them steer you toward your financial destiny.